
Three different things called a dashboard
Search for a home server dashboard and you get three kinds of software mixed together. Knowing which one you want saves an evening of installing the wrong thing.
- Start pages show links to your apps with icons, search and widgets: Homepage, Homarr, Dashy, Glance, Heimdall. They read from your services but do not install or run them.
- Monitoring dashboards show how the machine is doing over time, with graphs and alerts: Beszel, Netdata, Uptime Kuma, Grafana.
- Server managers install and run the apps and look after the host: Homeio, CasaOS, Cosmos, Umbrel, and container managers such as Portainer.
Most homelabs end up with one from each group, or with a server manager plus a start page. They do not compete as much as their feature lists suggest.
The popular options side by side
| Dashboard | Kind | Configured by | Best at | Licence |
|---|---|---|---|---|
| Homepage | Start page | YAML files and Docker labels | Fast, clean page with 100+ service widgets | GPL-3.0 |
| Homarr | Start page | Drag and drop in the browser | No-YAML setup, built-in logins, 40+ integrations | Apache-2.0 |
| Dashy | Start page | YAML or a built-in UI editor | Status checks, themes, many widgets | MIT |
| Glance | Start page | YAML | Feeds: RSS, Reddit, YouTube, weather, plus server status | AGPL-3.0 |
| Heimdall | Start page | The browser | The simplest app launcher | MIT |
| Beszel | Monitoring | The browser, with an agent per host | Lightweight history, Docker stats and alerts | MIT |
| Netdata | Monitoring | Nothing, out of the box | Per-second metrics for everything on the box | GPL-3.0 |
| Uptime Kuma | Monitoring | The browser | Is each service up, with notifications and status pages | MIT |
| Grafana + Prometheus | Monitoring | Queries and dashboards you build | Any metric, any graph, if you put in the time | AGPL-3.0 / Apache-2.0 |
| Homeio | Server manager | The browser | Installing and running apps, plus files, disks and backups | AGPL-3.0 |
| CasaOS | Server manager | The browser | One-click apps on existing Linux; no release since Dec 2024 | Apache-2.0 |
Every start page and monitoring tool listed had a release in the month before September 26, 2026.
Start pages: Homepage, Homarr, Dashy, Glance, Heimdall
A start page replaces the bookmarks folder full of IP addresses and ports. Open one URL and every service is there, often with a live number next to it: items in Sonarr's queue, blocked queries in Pi-hole, free space on a disk.
Homepage is a favourite of people comfortable with YAML. It is statically generated and fast, proxies every API call so your keys never reach the browser, has widgets for over 100 services, and can add a service automatically from labels on its Docker container. It has no login of its own, so keep it on your LAN or behind a VPN or an authenticating proxy.
Homarr is the one to pick if you never want to open a config file. You build the board by dragging tiles in the browser, it ships 40+ integrations and thousands of icons, and it has accounts and permissions built in, which matters if the family uses it too.
Dashy sits between them: YAML if you want it, a visual editor if you do not, with status checks on every item, many widgets and a lot of theming. Glance is different in spirit: it is a feed reader first, pulling RSS, Reddit, Hacker News, YouTube, weather and markets into one page, with widgets for server and container status alongside. Heimdall is the simplest: a grid of app tiles, some with live stats, set up entirely in the browser.
What none of them do is install an app, restart a crashed container, free up disk space or take a backup. For that you need a server manager, or SSH.
Monitoring dashboards: Beszel, Netdata, Uptime Kuma, Grafana
If what you want is graphs of CPU, memory, disk and network over days and weeks, and a message when something goes wrong, you want a monitoring tool rather than a start page.
- Beszel is the lightweight answer for a homelab: a hub with a web UI and a small agent on each machine, keeping history, per-container Docker stats and alerts. It is quick to set up and light on resources.
- Netdata collects per-second metrics for nearly everything on the machine with no configuration, and draws them straight away. It is the most detail for the least effort.
- Uptime Kuma answers a different question: is each service reachable? It checks HTTP, TCP, DNS and more on a schedule, sends notifications through dozens of channels, and can publish a status page.
- Grafana with Prometheus and node_exporter is the most flexible stack and the most work. Worth it when you want custom dashboards across many machines and services; overkill for one mini PC.
A common, cheap combination is Beszel for the machines and Uptime Kuma for the services. Both install as Docker apps in a few minutes.
Server managers: dashboards that run the box
A server manager is the dashboard you use to change things. It installs apps from a catalogue, shows their logs, updates and removes them, and, depending on the tool, manages files, disks, shares, backups and remote access on the host.
Some replace the operating system: umbrelOS and ZimaOS are complete systems with an app store. Others install on the Debian, Ubuntu or Raspberry Pi OS you already run: CasaOS, Cosmos, Runtipi and Homeio. Container managers such as Portainer and Dockge sit nearby, focused on containers and Compose stacks rather than the host. Our home server OS comparison covers all of these in detail.
Where Homeio fits
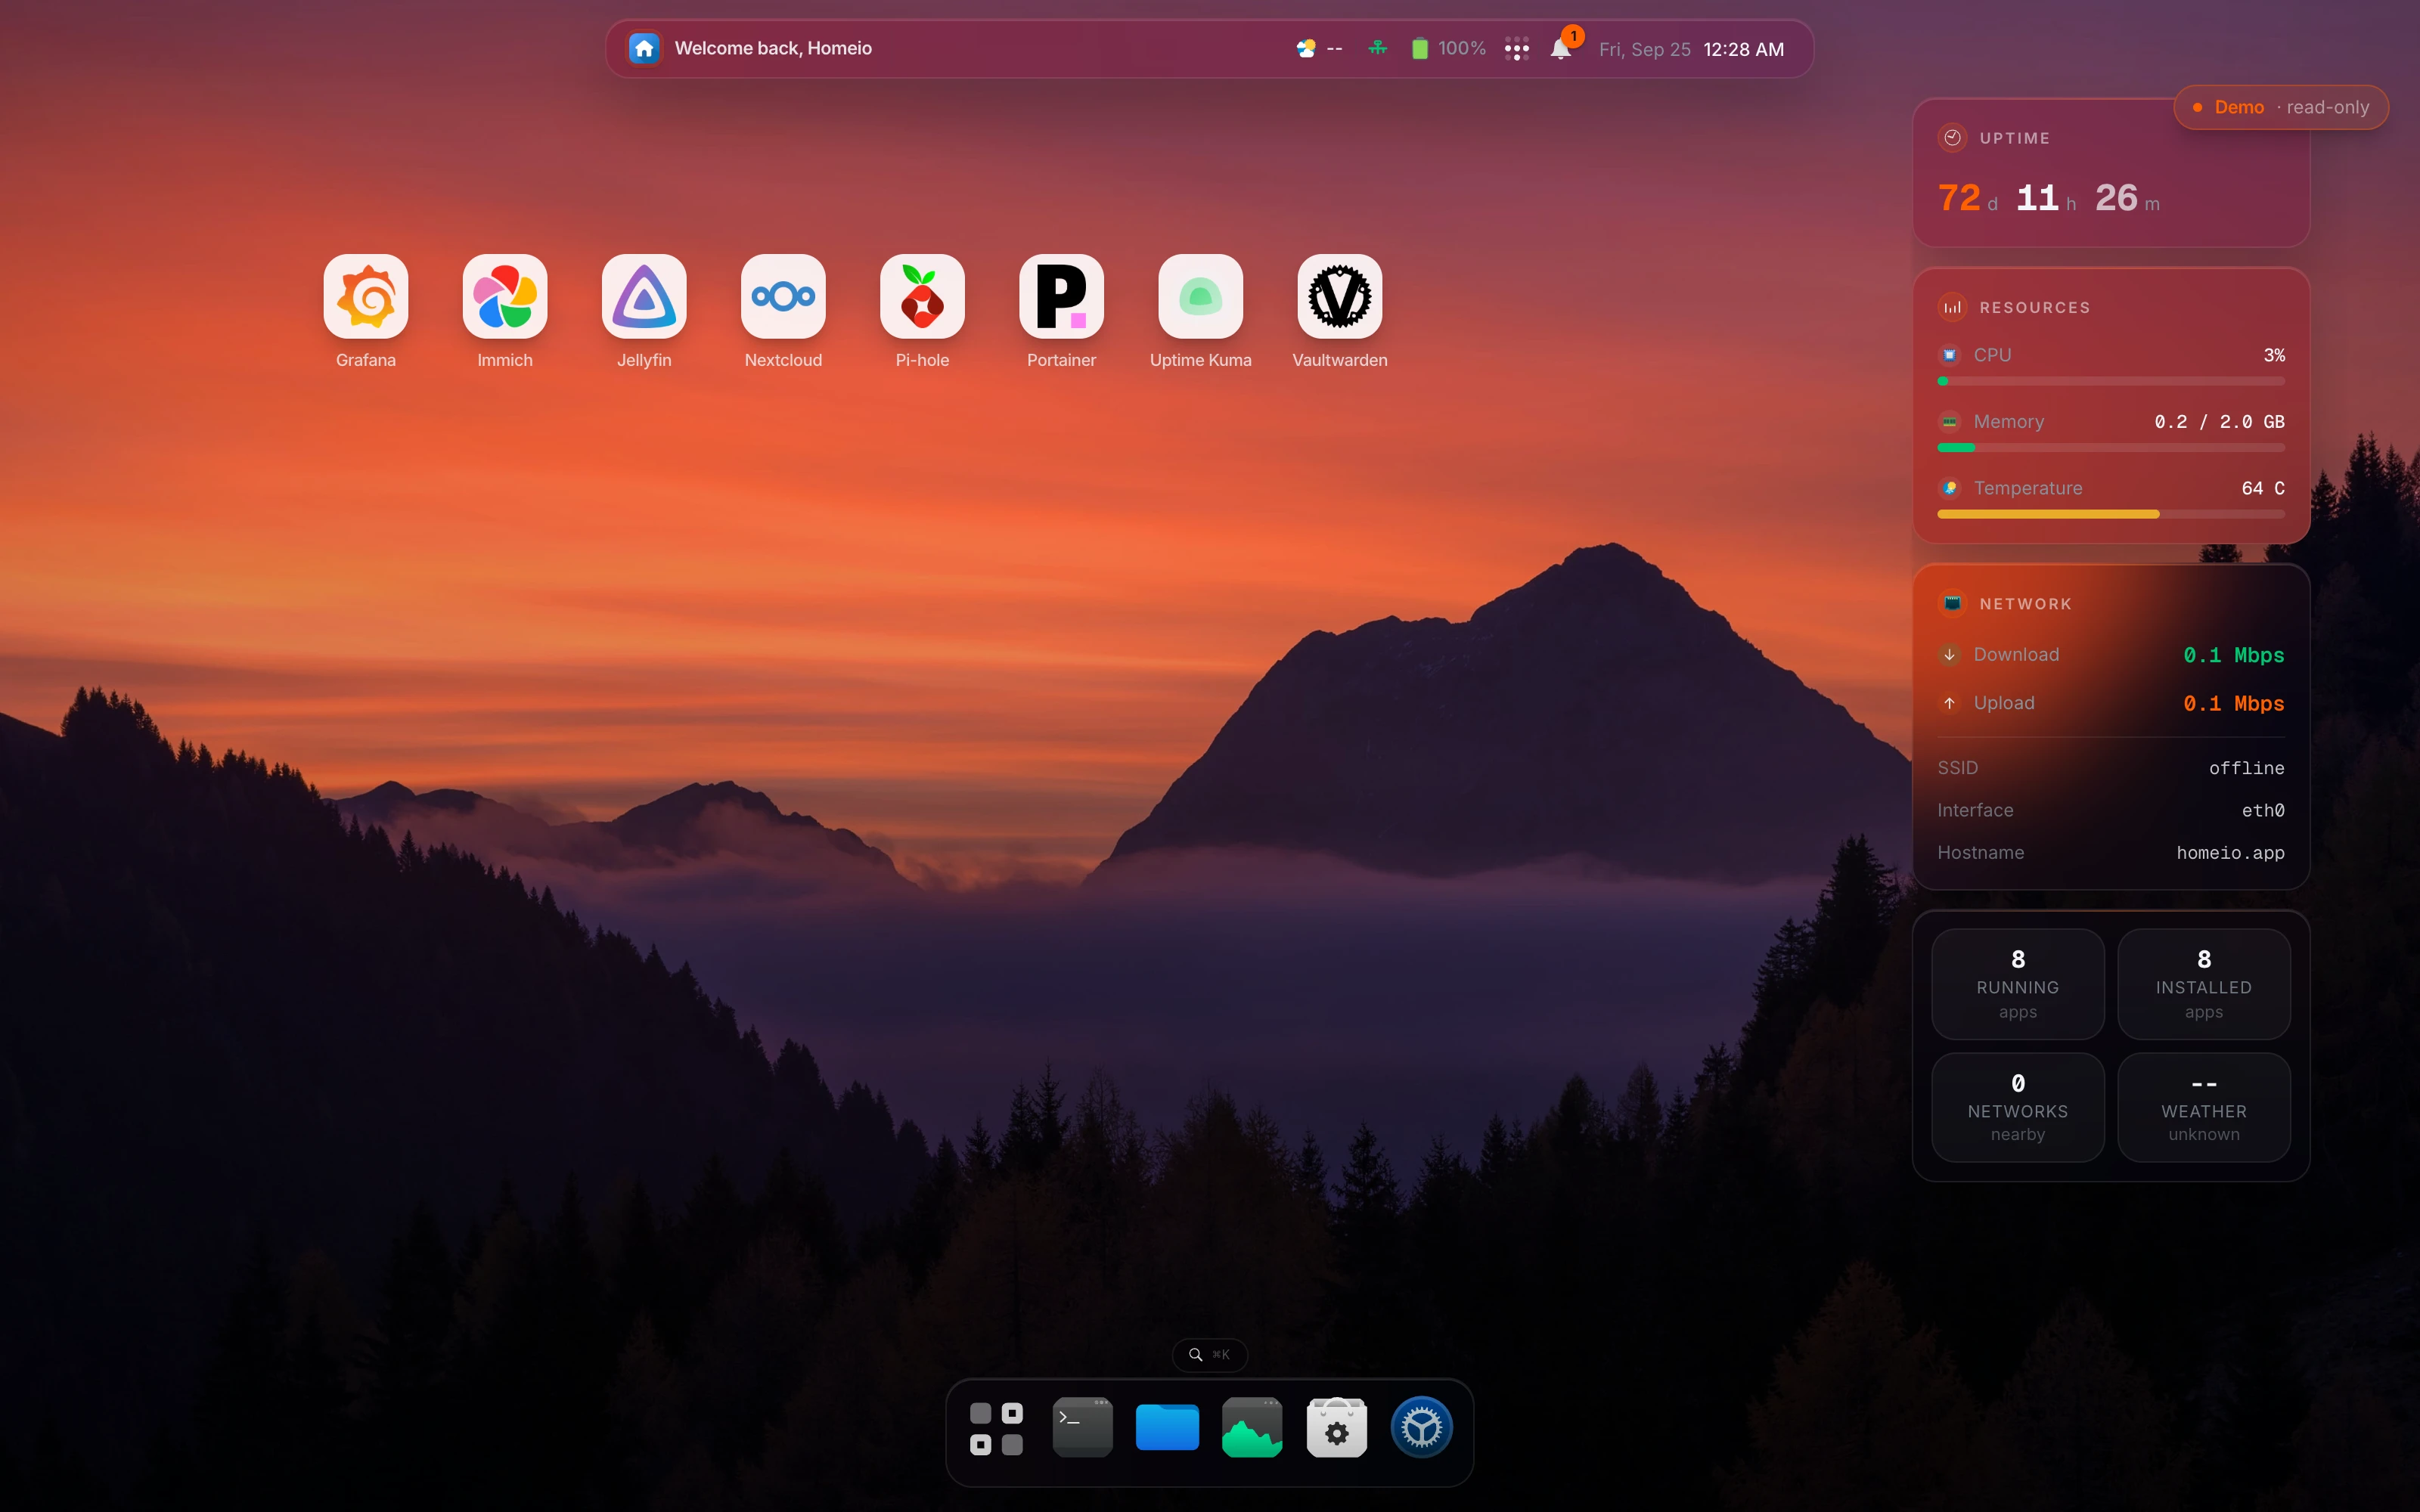
Homeio, the project behind this site, is a server manager with a desktop-style interface: windows, a dock and ⌘K search in the browser. It installs apps from the CasaOS app store or from your own Compose files, and in the same place gives you a file manager, disk partitioning and formatting, Samba shares, a cron scheduler, weekly backups, and Tailscale and Cloudflare Tunnel in Settings. Live CPU, memory, disk and network use are shown for the host and for each container.
It is not a start page and not a monitoring system. There are no service widgets like Homepage's, and no metric history or alert rules like Beszel's. A good setup is Homeio to manage the server and Homepage or Homarr as the everyday front door, added as custom apps from their Compose files since neither is in the CasaOS store, with Uptime Kuma from the store and Beszel added once the server matters.
If you are deciding between server managers, see our Docker app store guide and the comparisons with CasaOS, Portainer and Cosmos.
Which dashboard should you use?
- You want one page with all your apps and some live numbers, and YAML is fine: Homepage.
- Same, but you want to set it up by dragging tiles, with logins for the family: Homarr.
- You want your news, feeds and weather on the same page as your services: Glance.
- You want graphs and alerts for CPU, disk and memory: Beszel, or Netdata for more detail.
- You want to know when a service goes down: Uptime Kuma.
- You want to install, update and fix apps, and manage files, disks and backups, from the browser: a server manager such as Homeio or CasaOS.
- You are building a big multi-machine lab and enjoy the tooling: Grafana and Prometheus.
If you are just starting out, begin with the server manager, since it is how the other dashboards get installed. Our beginner setup guide walks through the whole first weekend.